Style and Color
We’ve shown a few times how to control figure aesthetics in seaborn, but let’s now go over it formally:
import seaborn as sns
import matplotlib.pyplot as plt
%matplotlib inline
tips = sns.load_dataset('tips')
Styles
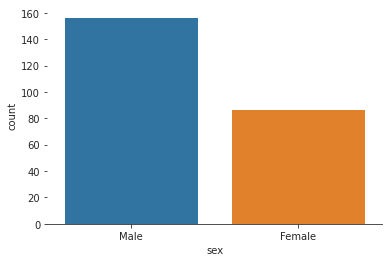
You can set particular styles
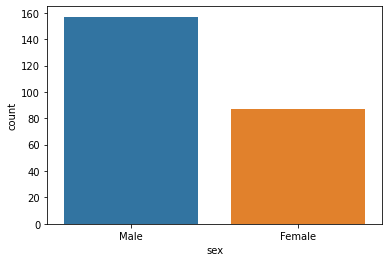
sns.countplot(x='sex',data=tips)
<matplotlib.axes._subplots.AxesSubplot at 0x7f861720a6d0>
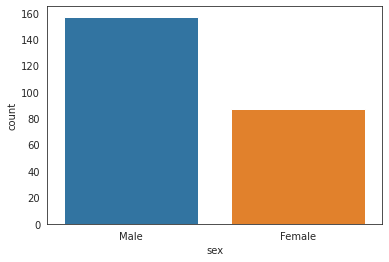
sns.set_style('white')
sns.countplot(x='sex',data=tips)
<matplotlib.axes._subplots.AxesSubplot at 0x7f86171049d0>
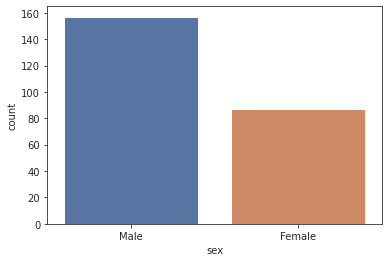
sns.set_style('ticks')
sns.countplot(x='sex',data=tips,palette='deep')
<matplotlib.axes._subplots.AxesSubplot at 0x7f8600838650>
Spine Removal
sns.countplot(x='sex',data=tips)
sns.despine()

sns.countplot(x='sex',data=tips)
sns.despine(left=True)
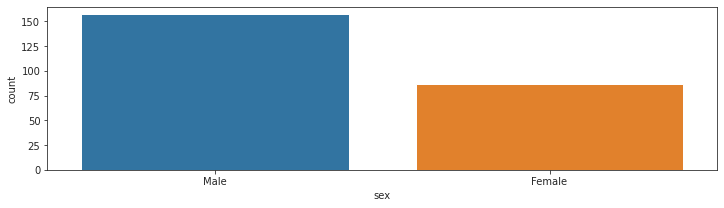
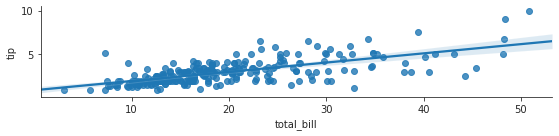
Size and Aspect
You can use matplotlib’s **plt.figure(figsize=(width,height) ** to change the size of most seaborn plots.
You can control the size and aspect ratio of most seaborn grid plots by passing in parameters: size, and aspect. For example:
# Non Grid Plot
plt.figure(figsize=(12,3))
sns.countplot(x='sex',data=tips)
<matplotlib.axes._subplots.AxesSubplot at 0x7f8616b3f890>
# Grid Type Plot
sns.lmplot(x='total_bill',y='tip',height=2,aspect=4,data=tips)
<seaborn.axisgrid.FacetGrid at 0x7f85f2c25290>
Scale and Context
The set_context() allows you to override default parameters:
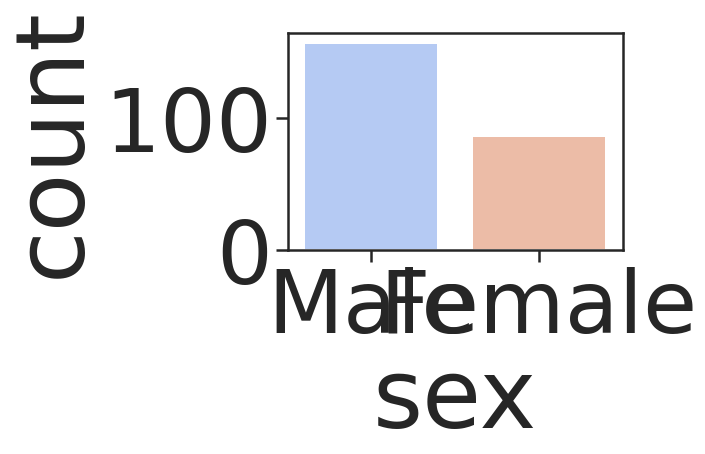
sns.set_context('poster',font_scale=4)
sns.countplot(x='sex',data=tips,palette='coolwarm')
<matplotlib.axes._subplots.AxesSubplot at 0x7f85f1f83bd0>