Grids
Grids are general types of plots that allow you to map plot types to rows and columns of a grid, this helps you create similar plots separated by features.
import seaborn as sns
import matplotlib.pyplot as plt
%matplotlib inline
iris = sns.load_dataset('iris')
iris.head()
| sepal_length | sepal_width | petal_length | petal_width | species | |
|---|---|---|---|---|---|
| 0 | 5.1 | 3.5 | 1.4 | 0.2 | setosa |
| 1 | 4.9 | 3.0 | 1.4 | 0.2 | setosa |
| 2 | 4.7 | 3.2 | 1.3 | 0.2 | setosa |
| 3 | 4.6 | 3.1 | 1.5 | 0.2 | setosa |
| 4 | 5.0 | 3.6 | 1.4 | 0.2 | setosa |
PairGrid
Pairgrid is a subplot grid for plotting pairwise relationships in a dataset.
# Just the Grid
sns.PairGrid(iris)
<seaborn.axisgrid.PairGrid at 0x7f907fdb8e10>
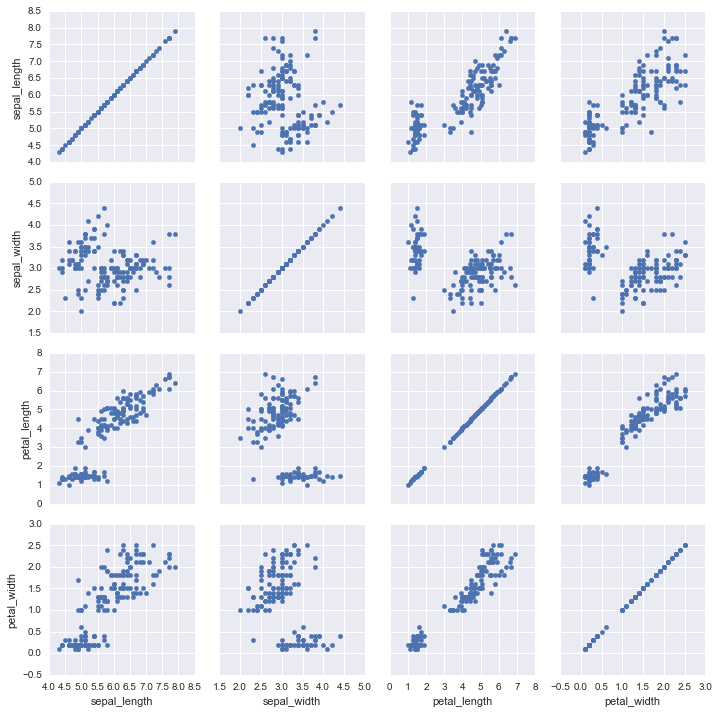
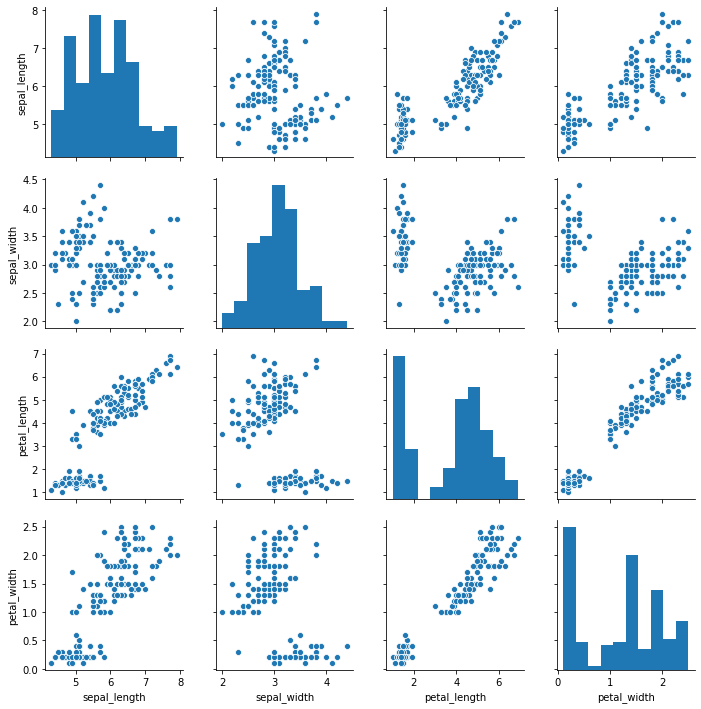
# Then you map to the grid
g = sns.PairGrid(iris)
g.map(plt.scatter)
<seaborn.axisgrid.PairGrid at 0x11f431208>
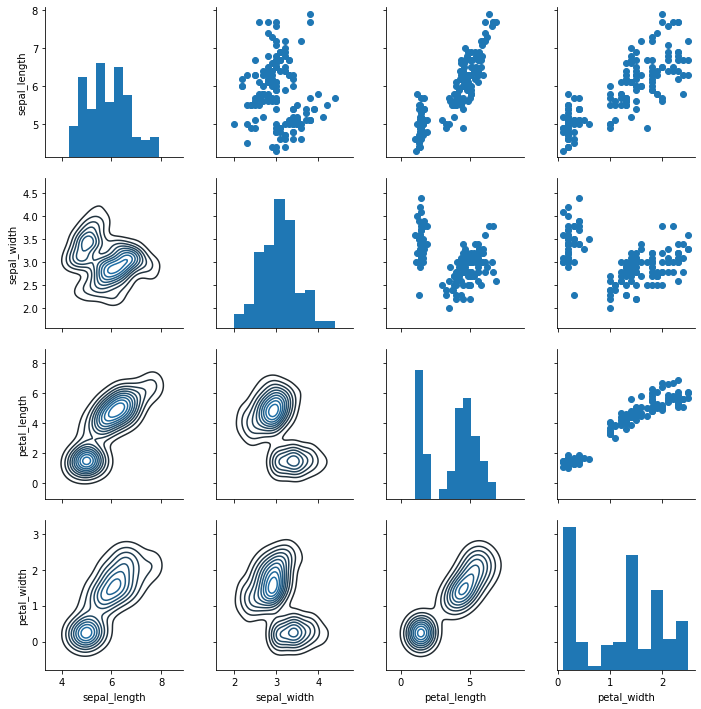
# Map to upper,lower, and diagonal
g = sns.PairGrid(iris)
g.map_diag(plt.hist)
g.map_upper(plt.scatter)
g.map_lower(sns.kdeplot)
<seaborn.axisgrid.PairGrid at 0x7f907fbce310>
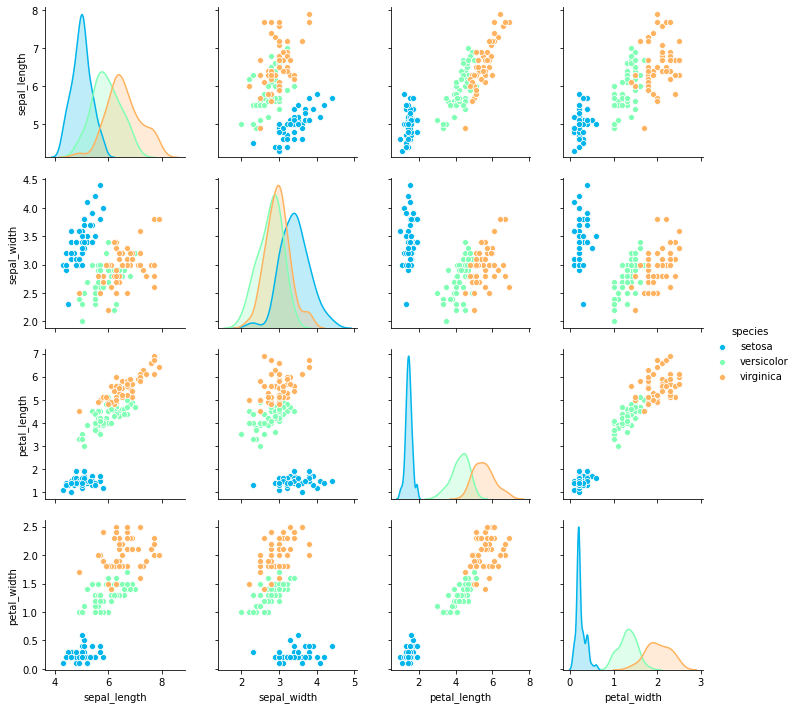
Pairplot
pairplot is a simpler version of PairGrid (you’ll use quite often)
sns.pairplot(iris)
<seaborn.axisgrid.PairGrid at 0x7f9064858c90>
sns.pairplot(iris,hue='species',palette='rainbow')
<seaborn.axisgrid.PairGrid at 0x7f90653074d0>
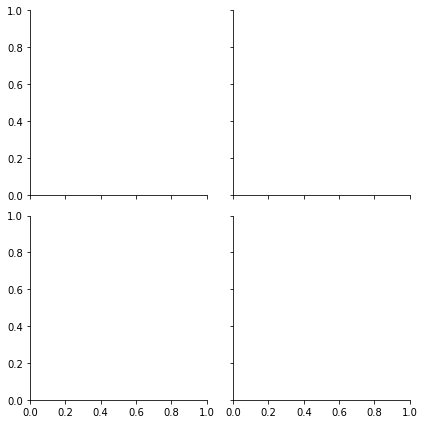
Facet Grid
FacetGrid is the general way to create grids of plots based off of a feature
tips = sns.load_dataset('tips')
tips.head()
| total_bill | tip | sex | smoker | day | time | size | |
|---|---|---|---|---|---|---|---|
| 0 | 16.99 | 1.01 | Female | No | Sun | Dinner | 2 |
| 1 | 10.34 | 1.66 | Male | No | Sun | Dinner | 3 |
| 2 | 21.01 | 3.50 | Male | No | Sun | Dinner | 3 |
| 3 | 23.68 | 3.31 | Male | No | Sun | Dinner | 2 |
| 4 | 24.59 | 3.61 | Female | No | Sun | Dinner | 4 |
# Just the Grid
g = sns.FacetGrid(tips, col="time", row="smoker")
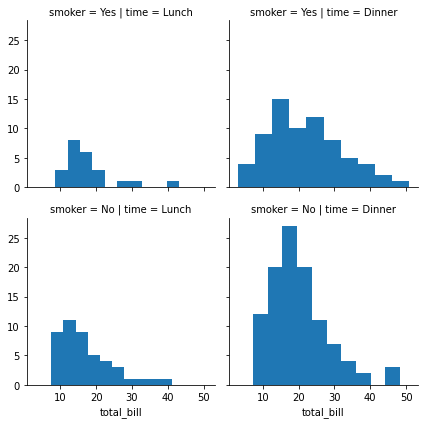
g = sns.FacetGrid(tips, col="time",  row="smoker")
g = g.map(plt.hist, "total_bill")
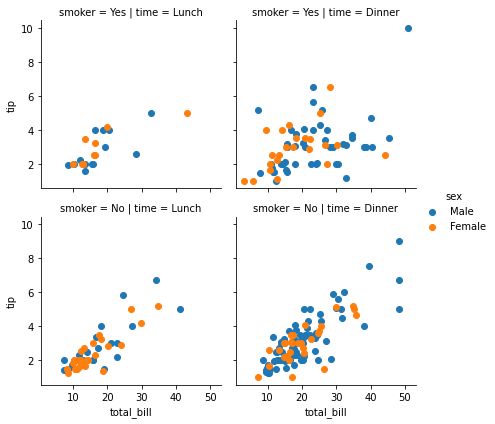
g = sns.FacetGrid(tips, col="time",  row="smoker",hue='sex')
# Notice hwo the arguments come after plt.scatter call
g = g.map(plt.scatter, "total_bill", "tip").add_legend()
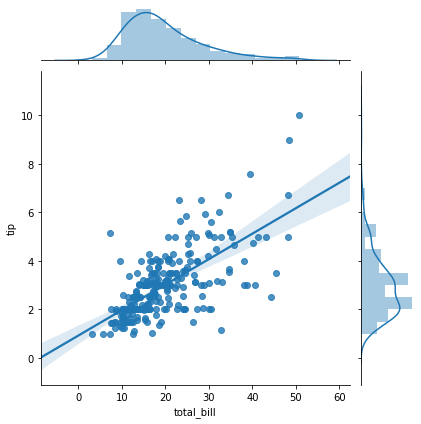
JointGrid
JointGrid is the general version for jointplot() type grids, for a quick example:
g = sns.JointGrid(x="total_bill", y="tip", data=tips)
g = sns.JointGrid(x="total_bill", y="tip", data=tips)
g = g.plot(sns.regplot, sns.distplot)