DataViz Gallery
Welcome to DataViz Gallery—a curated collection of compelling data visualizations using Python and R.
“A picture is worth a thousand words.”
— Frederick R. Barnard
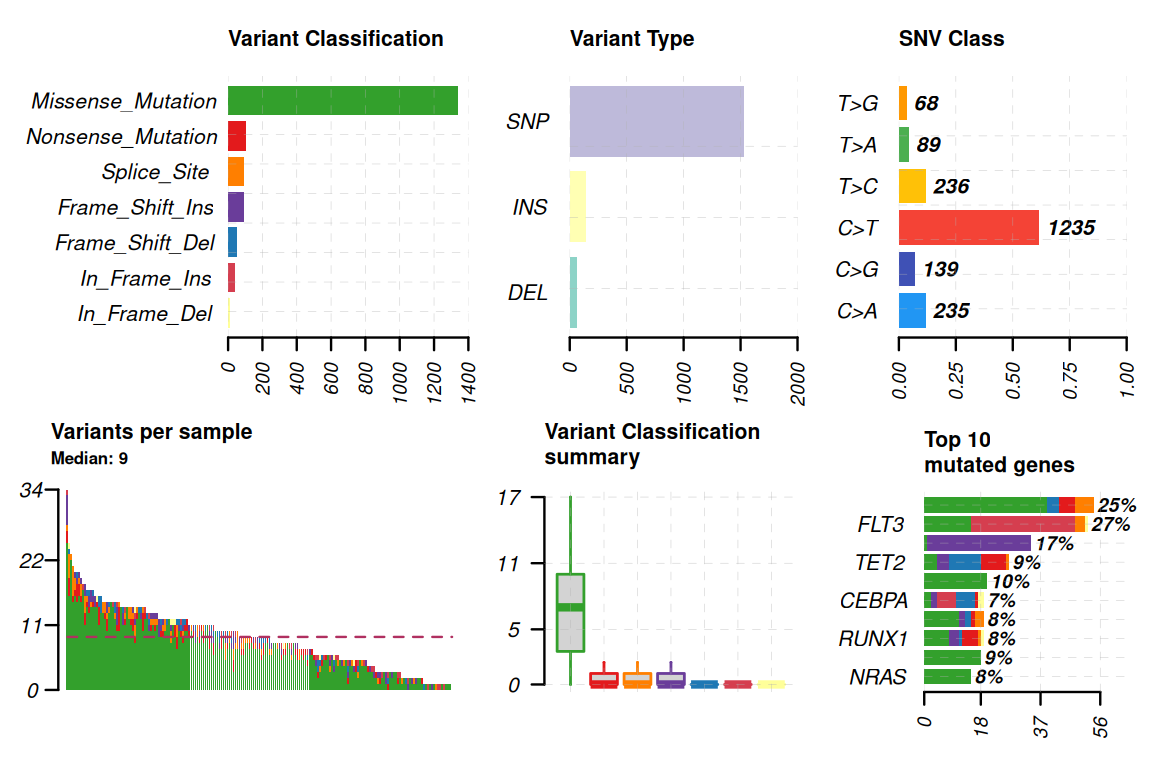
Plotting MAF summary with maftools
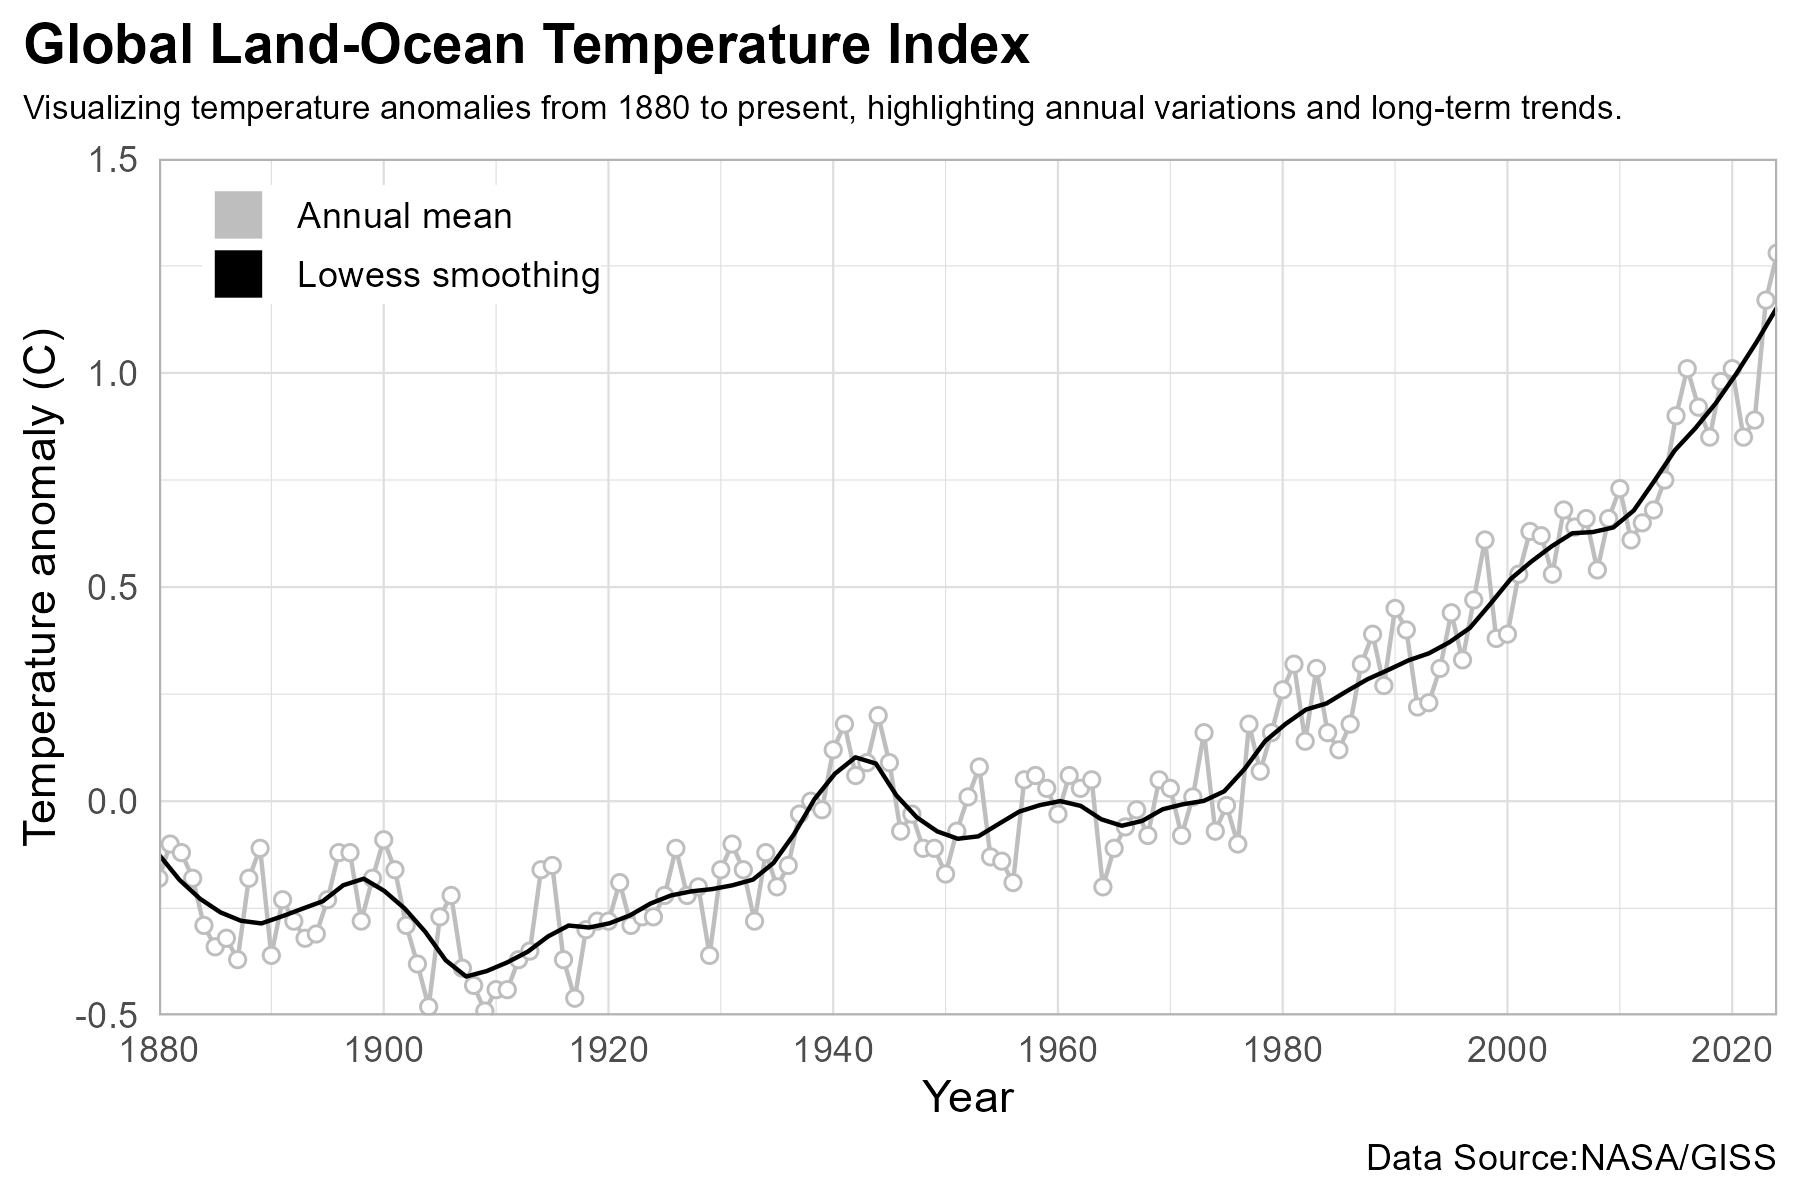
Global Temperature
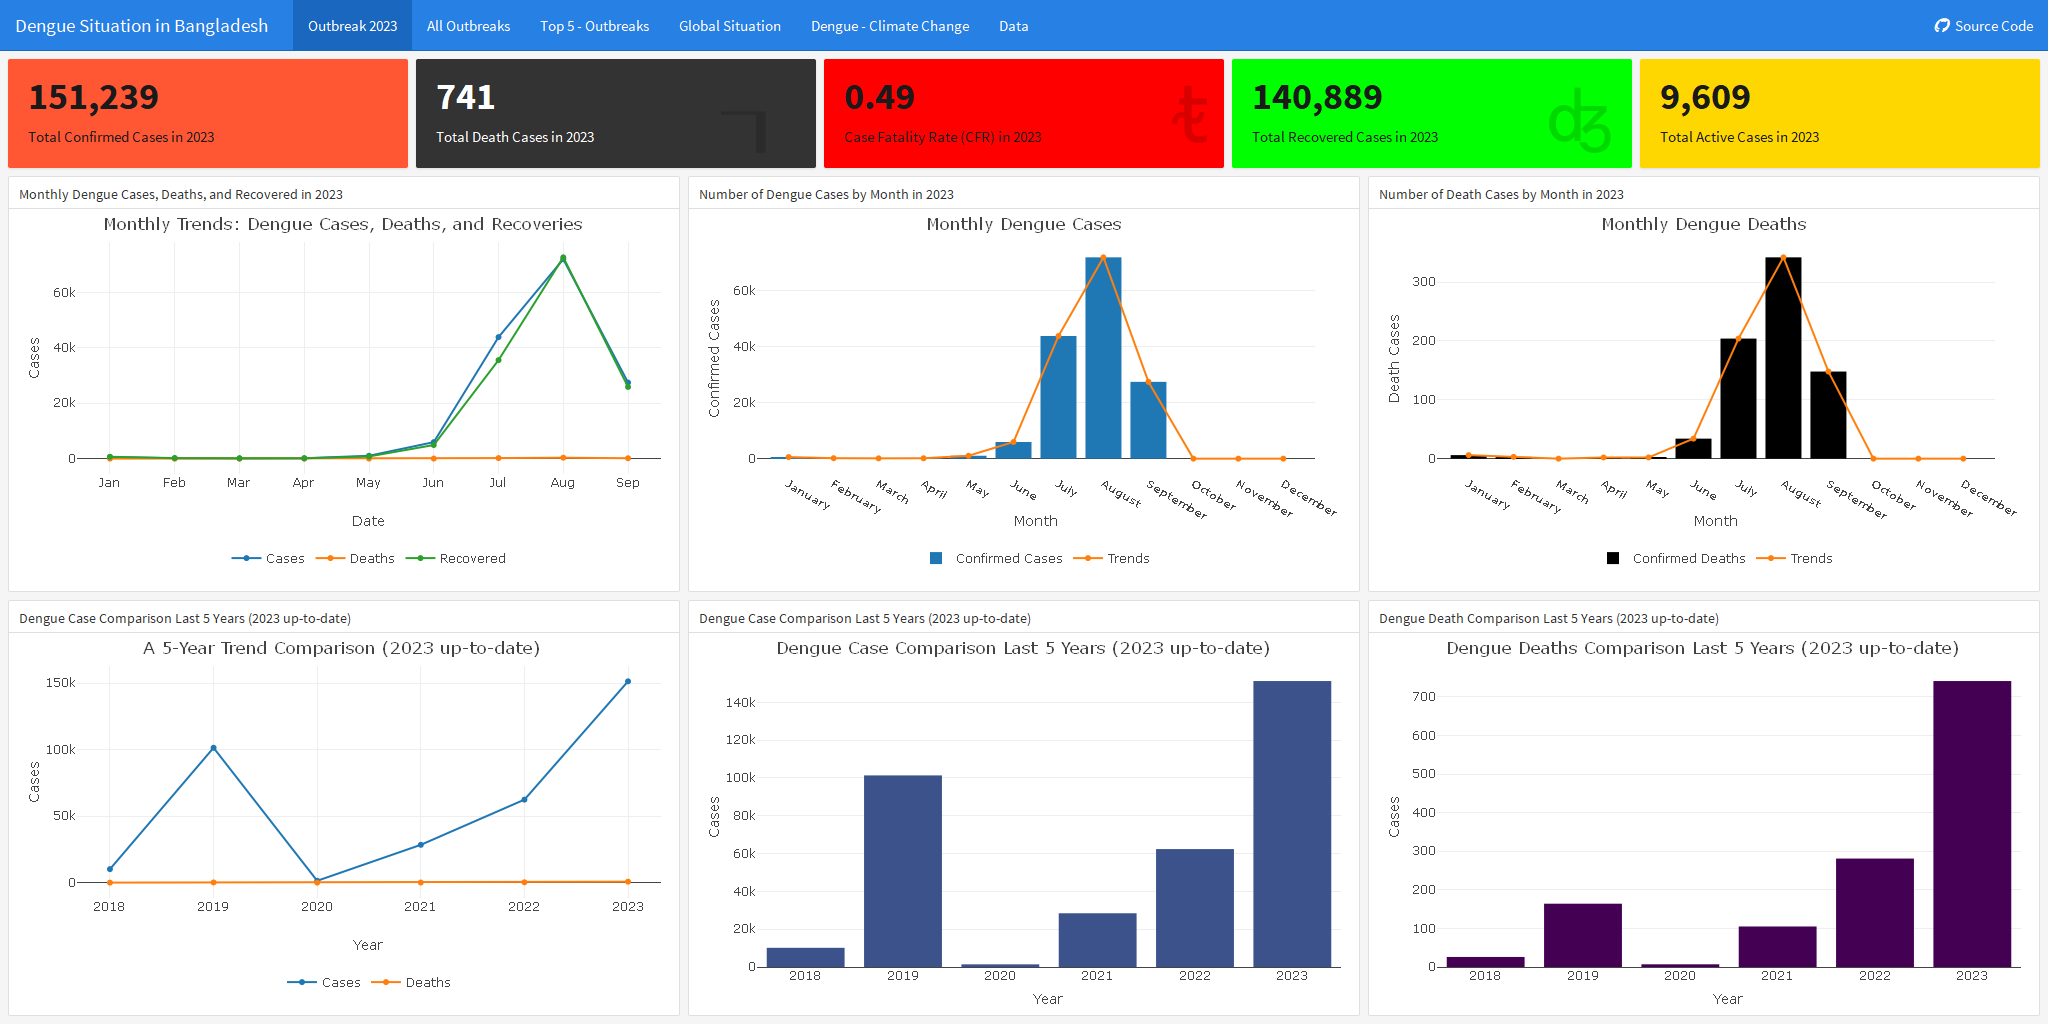
Dengue Situation in Bangladesh
Top 6 Packages for Data Visualization in R
The best R packages for data visualization.


ggplot2 Extensions
ggplot2 is very powerful on its own. But it gets even better thanks to its extensions.

Top 6 Packages for Bioinformatics
The best R packages for data visualization in bioinformatics.

R Packages for Geospatial Analysis
The best R packages for geospatial data visualization.

Colors
The best R packages for dealing with colors.


R Packages for Tables
The best R packages for creating tables.
No matching items